Sun Dec 28 2025
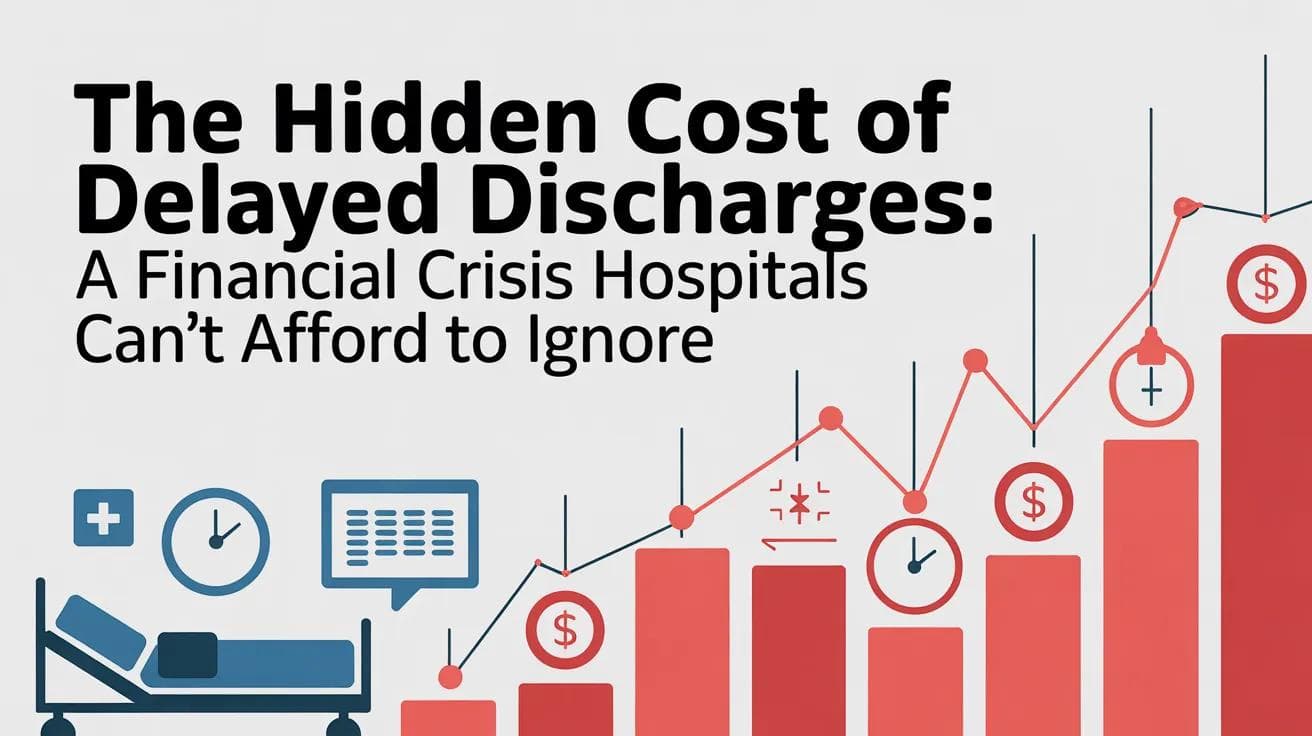
The Hidden Cost of Delayed Discharges: A Financial Crisis Hospitals Can't Afford to Ignore
Discharge delays cost Indian hospitals ₹50-90 lakhs annually through lost bed revenue, wasted nurse time, and reduced capacity. Most hospitals already have the solution—WhatsApp—they just need to add structure: clear ownership, automated escalations, and real-time visibility. One hospital achieved 38% faster discharges in 90 days.
How poor discharge coordination is costing Indian hospitals ₹50-90 lakhs annually—and what COOs can do about it
The 8 PM Phone Call Every Hospital COO Dreads
It's 8:15 PM on a Tuesday evening. Your phone rings. It's the Nursing Supervisor.
"Sir, we have a problem. The discharge that was supposed to happen at 2 PM is still here. Billing is saying they're waiting for TPA approval. TPA says they approved it at noon. Pharmacy didn't get the discharge prescription until 5:45 PM, and now it's past their working hours. The family is angry, we have a new admission waiting, and now we're scrambling to find a bed."
If you're a hospital COO, you've lived this scenario dozens—if not hundreds—of times.
What you might not know is the exact price tag attached to each of these delays.
Let's do the math.
The Real Cost of Every Delayed Discharge
The Obvious Costs (That Everyone Sees)
1. Lost Bed Revenue
A 200-bed hospital typically manages 40-50 discharges per day. Each delayed discharge blocks a bed that could be generating revenue.
- Average Revenue Per Occupied Bed (ARPOB): ₹8,000-12,000/day (for mid-tier private hospitals)
- Average delay per discharge: 4-6 hours
- Opportunity cost per delayed discharge: ₹2,000-3,000
Simple calculation:
- 45 discharges/day × 4-hour average delay × 50% of daily ARPOB
- = 45 × ₹2,500 = ₹1,12,500 lost per day
- = ₹41 lakhs per year in lost bed revenue alone
2. Extended Length of Stay (ALOS) Impact
When discharges are delayed, your Average Length of Stay increases. Even a 0.5-day increase in ALOS has massive implications:
- Current ALOS: 4 days (typical for multi-specialty hospitals)
- With discharge delays: 4.5 days
- Impact: 12.5% reduction in bed turnover capacity
For a 200-bed hospital at 80% occupancy:
- Lost capacity = 200 × 80% × 12.5% = 20 effective beds lost
- Capacity-equivalent loss: 20 beds × 365 days × ₹10,000 ARPOB = ₹7.3 crores
Note: This does not show up as a direct loss in your P&L, but it permanently caps revenue growth unless new beds are added. Think of it as opportunity cost—you're operating at 85% of your true revenue potential.
The Hidden Costs (That Destroy Margins)
3. Nurse Time Wasted on Follow-ups
This is where the real hemorrhaging happens—and it's almost never measured.
A recent study across 15 hospitals in South India found:
- Average nurse time spent chasing departments per discharge: 45-60 minutes
- Departments typically involved: Billing, Pharmacy, Lab, Radiology, TPA, Medical Records, Summary
The calculation:
- 45 discharges/day × 50 minutes per discharge = 37.5 hours/day
- = 5 full-time nurse equivalents (FTE) doing nothing but follow-up calls
- Annual cost = 5 FTE × ₹6 lakhs/year = ₹30 lakhs in wasted nurse labor
But it gets worse. Those nurses aren't providing patient care. Which means:
- Increased patient complaints (nurses unavailable)
- Higher nurse burnout and turnover (doing administrative work instead of clinical)
- Compromised patient safety (attention diverted from critical tasks)
4. Inter-department Coordination Failures
Every delayed discharge involves at least 5-7 handoffs between departments. Each handoff is a point of failure:
- Billing waits for approval → 30 min delay
- TPA approval received but not communicated → 45 min delay
- Pharmacy doesn't know discharge is ready → 60 min delay
- Medical records summary pending → 90 min delay
- Transport not arranged → 30 min delay
Compounding delays: These don't happen sequentially—they compound. A discharge that should take 2 hours takes 6-8 hours.
Cost of coordination failures:
- Duplicate work and rework
- Phone calls, WhatsApp messages, personal visits
- Manager escalations and firefighting
- Patient complaints and service recovery costs
Estimated annual cost: ₹15-25 lakhs
5. Emergency Department (ED) Boarding
When discharges are delayed, the admission queue backs up. New patients wait in the ED.
- Average ED holding time due to bed unavailability: 3-5 hours
- Opportunity cost: ₹5,000-8,000 per delayed admission
- Patient experience impact: Severe (leads to negative reviews, loss of future revenue)
For hospitals with 10-15 ED admissions per day:
- 10 admissions × 30% affected by bed delays × ₹6,000 opportunity cost × 365 days
- = ₹65 lakhs annual impact
6. Regulatory and Compliance Risk
Delayed discharges create documentation gaps:
- Incomplete discharge summaries
- Missing sign-offs and approvals
- Untracked medications or equipment
- NABH/JCI audit failures
Cost of non-compliance:
- Failed audits and re-accreditation delays
- Insurance claim denials due to documentation gaps
- Legal exposure from patient complaints
Estimated annual cost: ₹5-10 lakhs
The Total Annual Cost: A Conservative Estimate
For a 200-bed multi-specialty hospital:
Cost Category
Annual Impact
Lost bed revenue (opportunity cost)
₹41 lakhs
ALOS impact on capacity*
₹7.3 crores
Nurse time wasted on follow-ups
₹30 lakhs
Coordination failures and rework
₹20 lakhs
ED boarding and delayed admissions
₹65 lakhs
Compliance and documentation risk
₹8 lakhs
*Capacity-equivalent loss, not direct P&L impact
Direct operational costs (excluding ALOS capacity impact):
Annual cost = ₹1.64 crores (~₹50-90 lakhs for most hospitals when measured conservatively)
Why This Happens: The Root Cause
Hospital COOs often say: "We have an HIS. We have processes. Why does this still happen?"
The answer is simple: Discharge coordination is a people problem, not a technology problem.
The Reality of Hospital Operations
- WhatsApp is the real operating system
- Staff use personal WhatsApp groups for real-time coordination
- HIS is for documentation (after the fact)
- Actual work happens via calls and messages
- No ownership or accountability
- Tasks float in WhatsApp groups
- No one knows who's responsible
- Follow-ups are manual and exhausting
- Zero visibility for management
- COOs only hear about problems after 8 PM
- No real-time dashboard of discharge status
- Escalations happen too late
- Department silos
- Each department optimizes for itself
- No one owns the end-to-end discharge process
- Coordination happens ad-hoc
What Doesn't Work (And Why)
❌ Solution 1: "Let's train staff better"
Why it fails: Training doesn't solve structural problems. If the process relies on manual follow-ups, even well-trained staff will struggle.
❌ Solution 2: "Let's use our HIS discharge module"
Why it fails:
- Most hospitals already have HIS systems, but discharge modules have low adoption
- Staff find them cumbersome compared to WhatsApp
- Requires opening multiple screens, lengthy forms
- Real-time coordination still happens on WhatsApp anyway
- HIS is for documentation (after the fact), not real-time coordination
❌ Solution 3: "Let's hire a discharge coordinator"
Why it fails:
- One person can't chase 45 discharges/day across 6 departments
- Doesn't scale
- Creates a bottleneck
- Doesn't solve the systemic issue
❌ Solution 4: "Let's send more reminder emails"
Why it fails: Emails get ignored. The problem isn't lack of reminders—it's lack of structure and accountability.
What Actually Works: Structured Coordination
The solution isn't a new system. It's structuring the coordination you already do.
The Core Principles
Leading hospitals are solving this with three simple changes:
- Clear ownership: Every task has a named owner and deadline
- Automatic escalation: If tasks aren't acknowledged, supervisors are notified automatically
- Real-time visibility: Managers see what's stuck before it becomes a crisis
Here's the workflow:
Initiation → Nurse creates discharge request with key details Assignment → All departments receive their tasks simultaneously (not sequentially) Execution → Departments acknowledge, update progress, or request extensions Escalation → Automatic reminders if tasks aren't acknowledged within SLA Completion → Real-time dashboard shows progress; daily summary to leadership
The key difference from current processes: Departments work in parallel, not serial. Escalations are automatic, not manual.
This can be implemented using structured coordination platforms, custom workflows built on existing tools, or process redesign with clear protocols—the technology matters less than the structure.
The Results: Real Hospitals, Real Numbers
Case Study 1: 250-bed Tertiary Hospital, Chennai
Before structured coordination:
- Average discharge time: 6 hours from initiation
- Nurses spent 18 hours/week on follow-ups
- 3-4 late-evening delays per week requiring urgent escalation
After implementing structured workflows (90 days):
- Average discharge time: 3.7 hours (38% improvement)
- Nurse follow-up time: 6 hours/week (67% reduction)
- Late delays: Less than 1 per week
Financial Impact:
- Additional bed turnover: 3 patients/day
- Revenue gain: ₹10,000/bed × 3 × 365 = ₹1.09 crores/year
- Nurse time saved: 12 hours/week × ₹500/hour × 52 = ₹3.12 lakhs/year
- Total benefit: ₹1.12 crores
- Investment: ₹50,000/year
- Return: 22X in first year
Case Study 2: 180-bed Multi-Specialty Hospital, Hyderabad
Problem: Billing and TPA approvals were the biggest bottleneck. Discharges routinely delayed by 4-6 hours waiting for billing clearance.
Solution: Structured workflow with automatic escalation to billing supervisor if no response in 30 minutes.
Results (60 days):
- Billing approval time: From 4.5 hours → 1.2 hours
- Overall discharge time: From 5.8 hours → 3.4 hours
- Patient satisfaction (discharge process): From 6.2/10 → 8.7/10
Financial Impact:
- Faster bed turnover: +2.5 discharges/day capacity
- Annual revenue impact: ₹91 lakhs
The ROI of Fixing Discharge Coordination
Let's be conservative. For a 200-bed hospital:
Investment:
- Structured coordination solution: ₹2,499/month (₹30,000/year)
- Setup time: 24-48 hours
- Training required: Minimal (if using existing communication tools)
Note: Standard pricing shown. Custom pricing available for enterprise needs.
Conservative Benefits (first year):
- 20% reduction in discharge time: +6 bed-days/day effective capacity
- Revenue gain: 6 × 365 × ₹10,000 = ₹2.19 crores
- Nurse time saved: 60% reduction = 15 hours/week saved
- Value of nurse time: ₹3.9 lakhs/year
Total first-year benefit: ₹2.23 crores
Return: 74X in first year
Payback period: 2-3 weeks
Ready to see if ChatOps.health is right for your hospital?
📅 Book a 15-minute assessment call: https://calendly.com/chatps-health/15-min-demo
Why COOs Must Act Now
The Strategic Imperative
India needs 3 million additional hospital beds by 2025. Building new beds requires massive capital investment.
But what if you could unlock 10-15% more capacity from your existing beds?
That's what fixing discharge coordination does. It's the lowest-cost capacity expansion strategy available.
The Competitive Advantage
Hospitals that master discharge coordination gain:
- Higher bed utilization → More revenue from same assets
- Lower operational costs → Less nurse time wasted
- Better patient satisfaction → Fewer complaints, better reviews
- Stronger team morale → Nurses spend time on care, not calls
- Improved compliance → Complete audit trails, no documentation gaps
The Market Reality
Private hospitals in Tier 1 and Tier 2 cities are under pressure:
- Insurance reimbursements are flat or declining
- Patient expectations are rising
- Competition is intensifying
- Talent is expensive and scarce
You can't control reimbursement rates. But you can control operational efficiency.
What to Do Next: A 30-Day Action Plan
Week 1: Measure the Problem
- Track 20 consecutive discharges manually
- Note initiation time
- Note actual discharge time
- Document all delays and reasons
- Calculate opportunity cost
- Survey your nurses
- How much time do they spend on discharge follow-ups?
- What are the most common bottlenecks?
- What would make their lives easier?
- Calculate your annual cost
- Use the framework in this article
- Present to leadership with hard numbers
Week 2: Map the Current Process
- Document the discharge workflow
- Which departments are involved?
- What are the handoffs?
- Where do tasks get stuck?
- Identify the top 3 bottlenecks
- Is it billing/TPA approval?
- Pharmacy delays?
- Medical records?
- Talk to department heads
- What's causing delays on their end?
- What do they need to respond faster?
Week 3: Design the Solution
- Define the structured workflow
- Who needs to be notified when?
- What are the SLAs for each department?
- Who escalates if SLAs are missed?
- Choose the right approach
- If you have 15+ existing WhatsApp users in discharge process → Use WhatsApp-based coordination
- If you want something custom → Build on your existing tech stack
- If you want proven solution → Implement ChatOps-style platform
- Get buy-in from key stakeholders
- Nursing team (they're the primary users)
- Department heads (they need to commit to SLAs)
- IT team (for any integrations needed)
Week 4: Launch a Pilot
- Start with one ward or one department
- 10-15 discharges/day
- Run for 14 days
- Measure before vs. after
- Track the metrics
- Average discharge time
- Nurse follow-up hours
- Number of delays and escalations
- Patient satisfaction
- Iterate based on feedback
- What's working?
- What's not?
- Adjust SLAs and workflows
If you see 20-30% improvement in 14 days, roll it out hospital-wide.
The Bottom Line
Delayed discharges are costing your hospital ₹50-90 lakhs per year in direct operational costs—and capping your revenue potential by an additional ₹7-8 crores in lost capacity.
For larger hospitals (300-500 beds), the impact easily exceeds ₹2-3 crores annually.
This is one of the highest-leverage operational improvements available to hospital COOs.
The solution is straightforward:
- Structure the coordination process (ownership + SLAs)
- Automate escalations (reminders without manual follow-up)
- Provide real-time visibility (dashboards instead of 8 PM surprises)
The investment is minimal. The payback is measured in weeks, not quarters. The impact compounds every single day.
Take Action Today
If you're a hospital COO or operations leader:
- Calculate your actual cost using the framework above
- Present the findings to your leadership team
- Launch a 14-day pilot to prove the concept
- Scale what works across your hospital
The hospitals that master discharge coordination today will be the market leaders tomorrow.
The question is: Will yours be one of them?
About the Author
Prasanna K Ram is the Founder & CEO of ChatOps.health, a WhatsApp-based platform helping hospitals achieve predictable discharges. With deep expertise in hospital operations and workflow automation, Prasanna works with COOs across India to solve coordination challenges that impact bed utilization and patient care.
Want to see how structured discharge coordination works?
Book a 15-Minute Demo:
- 📅 Self-Schedule: calendly.com/chatps-health/15-min-demo
- 📱 WhatsApp: +91 98408 98818 - Message us with your preferred time
Quick Questions?
- 💬 WhatsApp: +91 98408 98818 - Get instant answers
- 📧 Email: pk@chatops.health
Resources:
- 📄 Case Studies: Real hospital results with proven metrics
- 🎯 14-Day Pilot: No commitment required - see measurable improvements in 2 weeks
Author: Prasanna K Ram
Founder & CEO - ChatOps.health
https://www.linkedin.com/in/prasannakram/
References
- Chauhan, A.S., Guinness, L., Bahuguna, P. et al. "Cost of hospital services in India: a multi-site study to inform provider payment rates and Health Technology Assessment." BMC Health Services Research 22, 1343 (2022). https://doi.org/10.1186/s12913-022-08707-7
- Average Length of Stay (ALOS) data: Apollo Hospitals Annual Report FY2023 (ALOS: 3 days), Fortis Healthcare Limited Annual Report FY2024 (ALOS: 4+ days), Narayana Health Annual Report FY2021 (ALOS: 4.5 days)
- India Brand Equity Foundation (IBEF). "Healthcare System in India" - Industry Analysis, Market Size, and Growth Report, 2024. Accessed December 2024. https://www.ibef.org/industry/healthcare-india
- Primary research: Case study analysis from structured discharge coordination implementations across tertiary hospitals in Chennai, Hyderabad, and Bangalore (2023-2024). Data validated through hospital operational metrics and COO interviews.
Written by
Prasanna K Ram
CEO